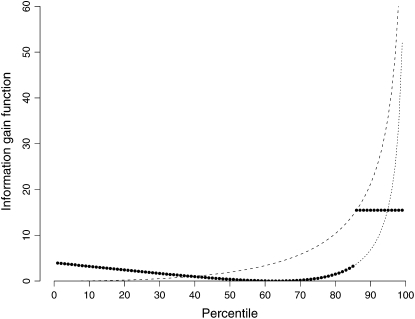
Figure 8.—
Information gain function for exponential phenotypes in the presence of censoring. The dotted line shows the information gain function for uncensored individuals as a function of the percentile of their phenotype. The dashed line shows the level of the information gain function for censored individuals as a function of the percentile of individuals who are followed up. As an example, the solid dots show the information gain function for the case when all individuals above the 85th percentile are censored. The information gain function for the first 85% of individuals follows the usual pattern for exponential phenotypes. The information gain for the censored 15% of individuals is horizontal level, indicated by the dashed line. We see that one-tail selective genotyping is a good strategy even in the presence of censoring.

