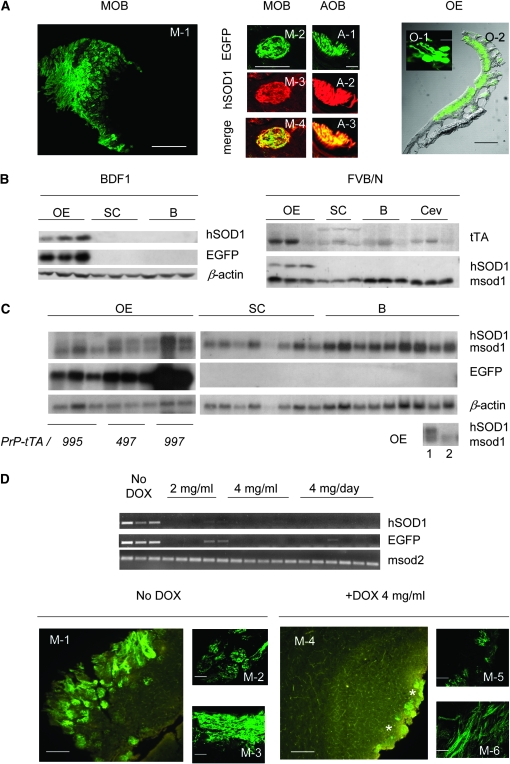
Figure 2.—
Restricted patterns of expression and doxycycline dependence. (A) Representative pattern of expression in tissue sections obtained by transcardial perfusion of double-transgenic mice (two to five animals/line). Main olfactory bulbs (MOB, M-1: bar, 800 μm; M-2–M-4: bar, 100 μm) and accessory olfactory bulbs (AOB, A-1–A-3: bar, 25 μm). Olfactory receptor neurons (O-1: bar, 10 μm) and olfactory epithelium (OE, O-2: bar, 500 μm). (B) Representative immunoblots [anti-EGFP monoclonal (Roche, Manheim, Germany); anti-SOD1 (Upstate, Lake Placid, NY); and monoclonal anti-β-actin (Immunological Sciences, Rome)]. (Left) Homogenates from double-transgenic mice from a representative EGFP-TRE-hG93ASOD1cDNA responder line in the BDF1 mouse strain background (tTA immunoblot in supplemental information). (Right) The same situation after changing the background of the same line to FVB/N (up to the eighth generation). (C) Northern blots (two to three double-transgenic mice from the three EGFP-TRE-hG93ASOD1cDNA lines). (Inset bottom right) Controls: 1, double-transgenic mouse; 2, nontransgenic mouse. (D) RT–PCR and representative tissue sections of doxycycline-treated mice dosed as indicated in drinking water with 5% sucrose over 1 week, compared to nontreated (No DOX) counterparts (three to six mice/group). The glomerular layer in the main olfactory bulb (M-1 and M-4: bar, 200 μm; M-2 and M-5: bar, 100 μm) and axonal projections (M-3 and M-6: bar, 50 μm) are shown. Stars indicate weak and low numbers of autofluorescent glomeruli. OE, olfactory epithelium; SC, spinal cord; B, brain; Cev, cerebellum; msod1 and msod2, murine superoxide dismutase types I and II.

