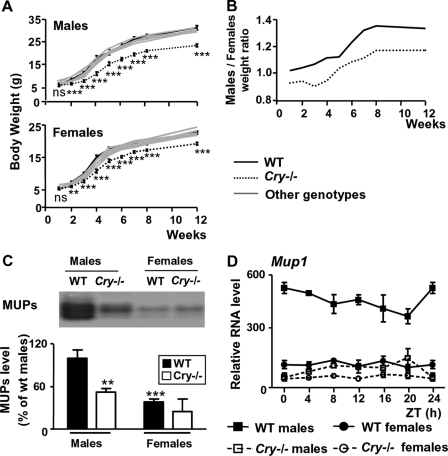
FIGURE 3.
The GH-dependent sex dimorphism is suppressed in Cry–/–mice. A, body weight of animals obtained from Cry1+/–/Cry2+/– intercrosses. Wild type (black solid line), Cry–/– (dotted line) and littermates bearing at least one wild type Cry allele (gray solid lines), males (upper panel) and females (lower panel), were weighted weekly from 1 to 8 weeks of age and at 12 weeks. Data are graphed as means ± S.E. ***, p < 0.005, **, p < 0.01, and ns, not significant, for control versus Cry–/– mice, Mann-Whitney U test. B, male/female body weight ratios for wild type (WT, solid line) and Cry–/– (dotted line) mice. Note that ratio values are close to 1 in Cry–/– mice, indicating a loss of sexually dimorphic growth rates. C, MUPs accumulation. A representative example of MUPs stained with Coomassie Blue after SDS-polyacrylamide gel electrophoresis (upper panel) and pooled analysis of MUPs content in urine of wild type (solid bars, n = 9 males and n = 14 females) and Cry–/– (open bars, n = 15 males and n = 12 females) is shown. ***, p < 0.005 and **, p < 0.01 as compared with wild type males (two-way ANOVA). D, Mup1 expression level in the liver of mice used in Fig. 1. The global statistical significance by two-way ANOVA is p < 0.001 between control males and females and between males of both genotypes.

