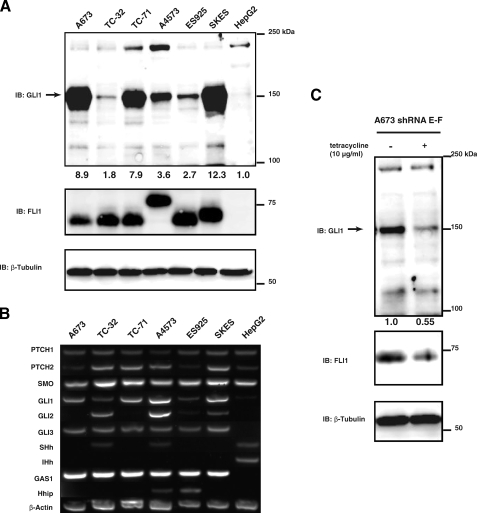
FIGURE 3.
GLI1 is expressed in ESFT cell lines, and knockdown of EWS-FLI1 decreases GLI1 expression in ESFT cell line A673. A, whole cell lysates from six different ESFT cell lines and HepG2 were subjected to SDS-PAGE. GLI1 expression was determined by immunoblotting with a GLI1 antibody. The arrow indicates the GLI1 band at 150 kDa. All of the ESFT cell lines express EWS-FLI1 as shown by immunoblotting with a Fli1 antibody. The size difference is due to the type of gene fusion that occurs. β-Tubulin was used a loading control. The numbers under the top panel are densitometry values. They are given as fold increase over the HepG2 cell line after normalizing each band to its corresponding loading control band value. B, total RNA from ESFT and HepG2 cell lines was isolated and analyzed by RT-PCR for Hedgehog pathway components. All of the ESFT cells lines express GLI1 as well as the GLI target GAS1. HepG2 does not express any GLI genes or GAS1. Of the ESFT cells only TC-32 and A4573 expresses Hh ligand. β-Actin was used as a positive control. Desert Hedgehog was also examined and was negative for all cell lines (data not shown). C, A673 cells stably transfected with a tetracycline inducible shRNA for EWS-FLI1 were plated and treated with 0 or 10 μg/ml of tetracycline for 96 h. After 96 h the cells were lysed, and whole cell lysates were subjected to SDS-PAGE and subsequent immunoblotting with GLI1, FLI1, or β-tubulin antibody. FLI1 immunoblotting confirmed the knockdown of EWS-FLI1 in tetracycline treated cells and actin was used as a loading control. IB, immunoblotting.

