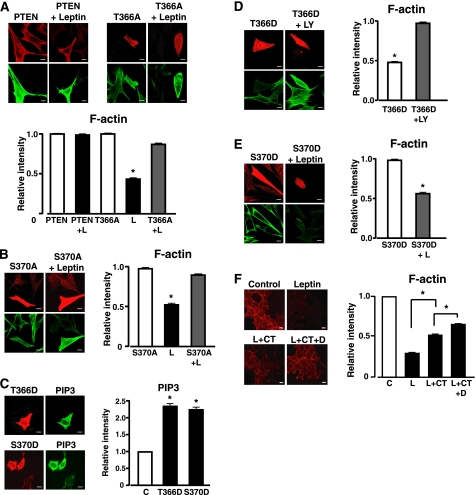
FIGURE 2.
Effect of PTEN phosphorylation mutants on PtdIns(3,4,5)P3 and F-actin levels in N29/4 cells. Wild-type PTEN and T366A PTEN (A) and S370A PTEN (B) were overexpressed in N29/4 cells (upper panels, Cy3 secondary antibody on cells treated with monoclonal PTEN antibody) and F-actin visualized with Alexa 488-phalloidin (lower panels) with and without stimulation by 10 nm leptin. Note that untransfected cells in the leptin (L)-treated group are not easily visible in the right lower panels due to leptin-mediated F-actin depolymerization. Bar graphs showing mean levels of F-actin after treatment of N29/4 cells ± overexpression of PTEN or T366A PTEN (A) or S370A PTEN (B) with 10 nm leptin. Data are shown as a ratio of control, untreated cells. C, PtdIns(3,4,5)P3 levels in N29/4 cells transfected with T366D PTEN or S370D PTEN were investigated using a PtdIns(3,4,5)P3 antibody. The bar graph shows mean levels of PtdIns(3,4,5)P3 (as a ratio of control) in N29/4 cells after treatment with these PTEN phosphorylation mutants. D and E, F-actin levels were visualized (lower panels) in N29/4 cells transfected (upper panels) with T366D PTEN (D) or S370D PTEN (E) in the absence (left) and presence (right) of 10 μm LY294002 (LY, D) or 10 nm leptin (E). The bar graphs show mean levels of F-actin after treatment of N29/4 cells overexpressing T366D PTEN (D) or S370D PTEN (E). Data are shown as a ratio of control, untreated cells. F, cellular F-actin levels in the absence or presence of 10 nm leptin and in cells pretreated with 2 μm CT99021 alone (CT) or in combination with 10 μm DMAT (D) before leptin challenge. Note that F-actin is visualized in this series of experiments with rhodamine-conjugated phalloidin. The bar graph denotes mean levels of F-actin-treated cells. Data are shown as the ratio of control, untreated cells. Values represent the mean ± S.E. for 3–4 experiments per group. *, p < 0.05 compared with the appropriate labeled control for each treatment. Scale bars, 10 μm. PIP3, PtdIns(3,4,5)P3.

