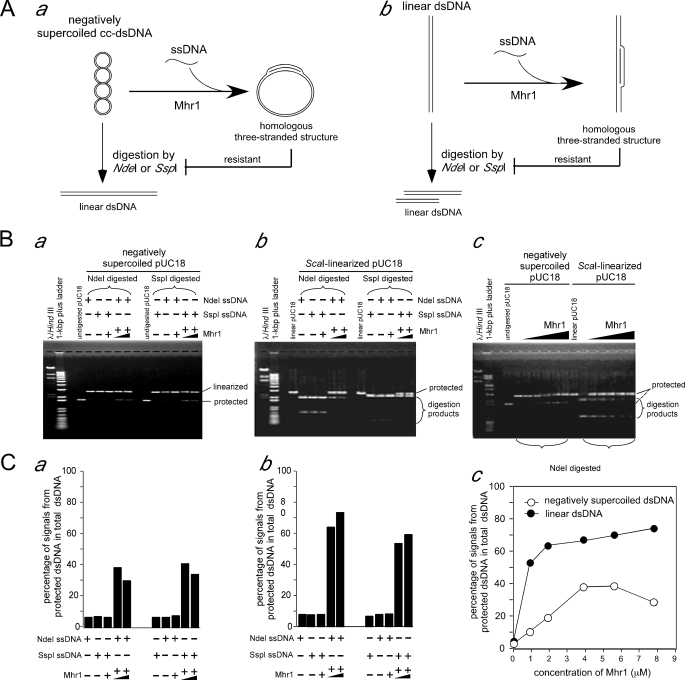
FIGURE 3.
Mhr1-catalyzed homologous three-stranded structure formation with negatively supercoiled cc-dsDNA or linear dsDNA measured by a restriction endonuclease protection assay. A, schematic diagrams of the restriction endonuclease protection assay for the homologous pairing of a ssDNA oligonucleotide with negatively supercoiled cc-dsDNA (a) or linear dsDNA (b). B, homologous three-stranded structures formed using negatively supercoiled cc-dsDNA (a and the left half of c) or linear dsDNA (b and the right half of c). After the Mhr1-ssDNA oligonucleotide complexes were formed by incubating Mhr1 with the NdeI ssDNA oligonucleotide or the SspI ssDNA oligonucleotide at 37 °C for 30 min, the dsDNA solution was then added to initiate the Mhr1-catalyzed reaction at 37 °C for 30 min. All of the DNA and protein concentrations are the final concentrations after the formation of the complete reaction mixture, unless otherwise stated. In this experiment, two sets (in a and b) or a single set of 41.8 μm negatively supercoiled pUC18 cc-dsDNA (in a and c) or linear dsDNA (in b and c) were incubated with 1.3 μm NdeI ssDNA oligonucleotide (in a–c) or SspI ssDNA oligonucleotide (in a and b) and Mhr1 (3.9 or 7.8 μm in a and b; 0, 0.93, 1.9, 3.9, 5.6, or 7.8 μm in c) at 37 °C for 30 min. In these experiments, ssDNA oligonucleotide and Mhr1 were incubated at 37 °C for 30 min before the addition of dsDNA. After digestion with NdeI or SspI, the proteins were removed by treatments with SDS and proteinase K, and the DNA products were subjected to electrophoresis on 1% agarose gels in the presence of 0.3 μg/ml ethidium bromide. NdeI and SspI each cleave pUC18-dsDNA at a single site. The homologous three-stranded structures formed with the NdeI or SspI ssDNA oligonucleotide, at the NdeI or SspI site, protected the dsDNA from cleavage by NdeI or SspI and are thus resistant to the treatment with the restriction endonucleases, respectively, but are still sensitive to SspI or Nde1, respectively. C, quantitative analysis of the DNA bands in the gels shown in B. The DNA species were detected by a Southern blot analysis, using 32P-labeled pUC18 DNA as a probe. The percentages of signals derived from NdeI- or SspI-resistant supercoiled pUC18 DNA or linear DNA among those from the total dsDNA are plotted.

