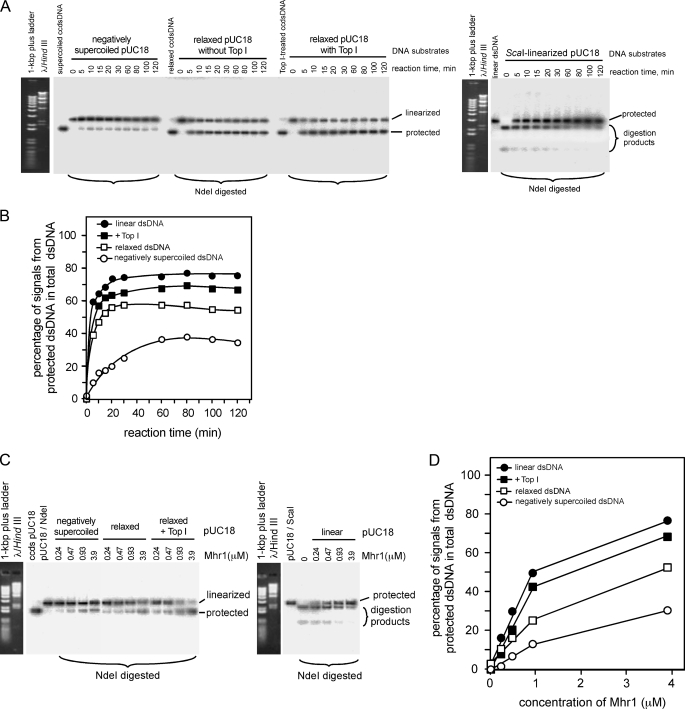
FIGURE 7.
Comparison of negatively supercoiled cc-dsDNA and relaxed cc-dsDNA as the dsDNA substrate for Mhr1-catalyzed formation of homologous three-stranded structures in the presence or absence of eukaryotic topoisomerase I. A, time dependence of Mhr1-catalyzed homologous three-stranded structure formation. Negatively supercoiled pUC18 cc-dsDNA, relaxed pUC18 cc-dsDNA, relaxed pUC18 cc-dsDNA containing active calf thymus topoisomerase I, or ScaI-linearized pUC18 dsDNA (∼41.8 μm) was incubated with the reaction mixture containing 1.3 μm NdeI ssDNA oligonucleotide and Mhr1 (0 or 3.9 μm) at 37 °C for the indicated time periods in the order described in the legends to Figs. 3B and 4B. After the incubation, the DNA products were digested with NdeI, and the proteins were removed by SDS and proteinase K treatments. The DNA products were then subjected to electrophoresis on 1% agarose gels containing ethidium bromide, and the DNA products in the gel were transferred to nylon plus membranes. The signals representing the DNA species were detected by a Southern blot analysis, using 32P-labeled pUC18 as a probe. B, quantitative representations of the results shown in A. The percentages of the signals representing the DNA species detected by a Southern blot analysis among those from the total dsDNA are plotted, as describedin the legend to Fig. 3C. •, linear dsDNA; ▪, relaxed cc-dsDNA with the topoisomerase I; □, relaxed cc-dsDNA (in the absence of topoisomerase); ○, negatively supercoiled cc-dsDNA. C, dependence of the three-stranded structure formation on the Mhr1 concentration. Negatively supercoiled pUC18 cc-dsDNA, relaxed pUC18 cc-dsDNA, relaxed pUC18 cc-dsDNA containing active calf thymus topoisomerase I, or ScaI-linearized pUC18 dsDNA (∼41.8 μm) was incubated with the reaction mixture containing 1.3 μm NdeI ssDNA oligonucleotide and the indicated amounts of Mhr1 at 37 °C for 30 min, as in A. After the incubation, the DNA products were digested with NdeI, and the proteins were removed by SDS and proteinase K treatments. The DNA products were then analyzed as described in A. D, quantitative representations of the results shown in C. Symbols are the same as those in B.

