FIGURE 4.
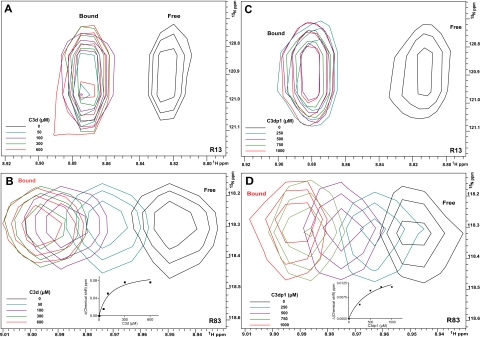
NMR titration analysis reveals that SCR1 and SCR2 of CR2 are both involved in the ligation with C3d and C3d-inhibitory peptide C3dp1. A and B, five superimposed 1H-15N TROSY-HSQC spectra of 15N-labeled CR2 SCR1-2 (0.3 mm in 1/3× PBS) collected during titration with increasing amounts of C3d. Black, no C3d; blue, with 50 μm C3d; purple, with 100 μm C3d; green, with 300 μm C3d; red, with 600 μm C3d. Inset on B, the binding curve for the CR2-C3d weak interaction. C and D, five superimposed 1H-15N TROSY-HSQC spectra of 15N-labeled CR2 SCR1-2 (0.3 mm in 1/3× PBS) collected during titration with increasing amounts of C3dp1. Black, no C3dp1; blue, with 250 μm C3dp1; purple, with 500 μm C3dp1; green, with 750 μm C3dp1; red, with 1000 μm C3dp1. Inset in D, binding curve for the CR2-C3dp1 weak interaction. Residues monitored were Arg13 (A and C) and Arg83 (B and D). The numbering system used here within for CR2 is based on the reported amino acid sequence for the mature protein (5).

