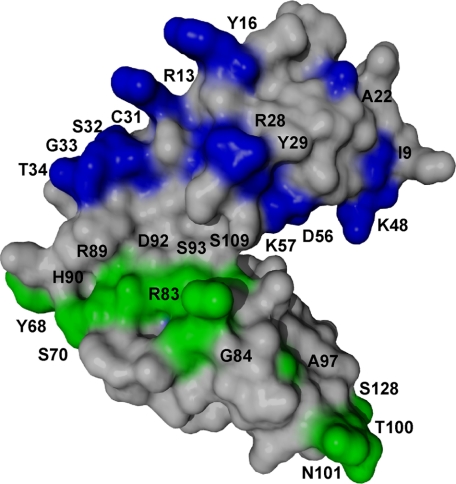
FIGURE 5.
Surface representation of CR2 SCR1-2 x-ray crystal structure in its ligand-bound state (C3d not shown) with NMR-determined C3d binding residues mapped out. Gray residues represent residues unaffected by C3dp titration. The blue residues on SCR1 represent the tight binding affinity interactions on CR2 between CR2 and C3d. The green residues on the linker and SCR2 represent the weaker affinity binding interactions on CR2 between CR2 and C3d.

