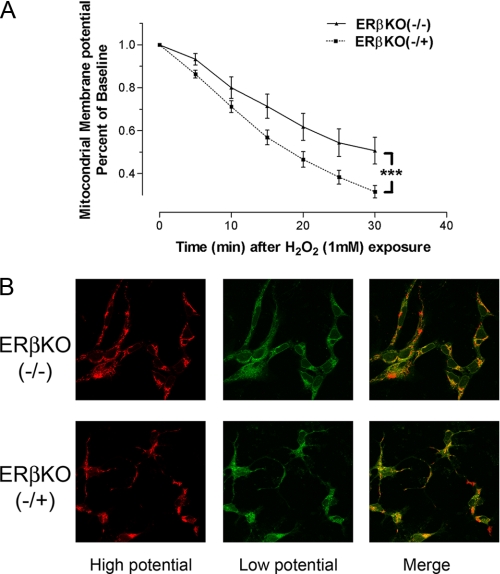
FIGURE 5.
A, quantitative analysis of dynamic changes in mitochondria membrane potential (Δψm) under H2O2 exposure in hippocampal neuronal cultures derived from homozygous (ERβKO(-/-)) and heterozygous (ERβKO(-/+)) ERβ knock-out mice. Δψm collapse was evaluated by JC-1 fluorescence intensity. ***, p < 0.001. B, representative confocal microscopy image after 30 min of H2O2 exposure.

