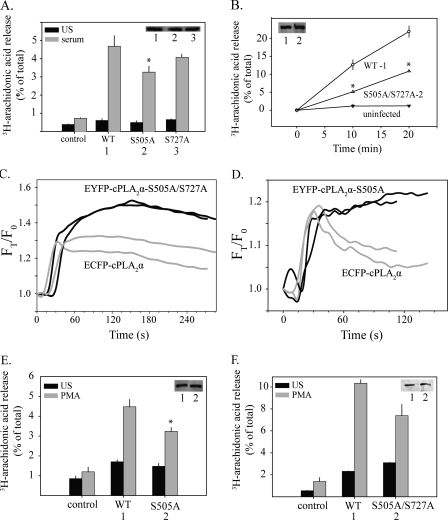
FIGURE 8.
AA release and translocation of cPLA2α phosphorylation site mutants. Parallel cultures of [3H]AA-labeled IMLF-/- expressing either wild type ECFP-cPLA2α (WT) or EYFP-cPLA2α phosphorylation site mutants as indicated were stimulated for 10 min with serum (A and B) or for 45 min with PMA (E and F). [3H]AA released into the medium is expressed as a percentage of the total cellular radioactivity in each well. Immunoblotting was conducted to determine expression levels of wild type and mutant cPLA2α in each well (insets). [3H]AA release is shown from wells with matching expression levels. The release of [3H]AA by the mutants was significantly less (p < 0.05) than by wild type cPLA2α, as indicated (*). Live cell images of IMLF-/- co-expressing wild type ECFP-cPLA2α and either EYFP-cPLA2αS505A/S727A (C) or EYFP-cPLA2αS505A (D) were collected every 3 s after serum stimulation, using CFP and YFP filters and a ×40 oil immersion objective. Translocation to Golgi in cells expressing wild type (gray lines) or mutant cPLA2α (black lines) is shown for two representative cells. Values are corrected for background fluorescence and differential bleaching and are presented relative to time zero (FT/F0). Data are representative of 20 individual cells from three independent experiments.

