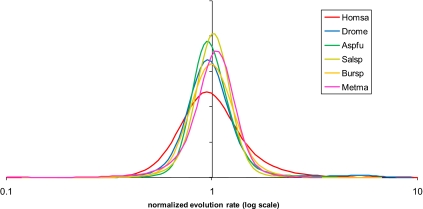
Fig. 1.
Distributions of nucleotide sequence evolution rates for pairs of closely related eukaryotic, archaeal, and bacterial genomes. The evolutionary distances were calculated using the Jukes–Cantor correction and normalized so that the mean of each distribution was equal to 1. Metma, Methanococcus maripaludis C5 vs. M. maripaludis C7 (Euryarchaeota); Bursp, Burkholderia cenocepacia MC0–3 vs. B. vietnamiensis G4 (Proteobacteria); Salsp, Salinispora arenicola CNS-205 vs. S. tropica CNB-440 (Actinobacteria). The probability density curves were obtained by Gaussian-kernel smoothing of the individual data points (64).

