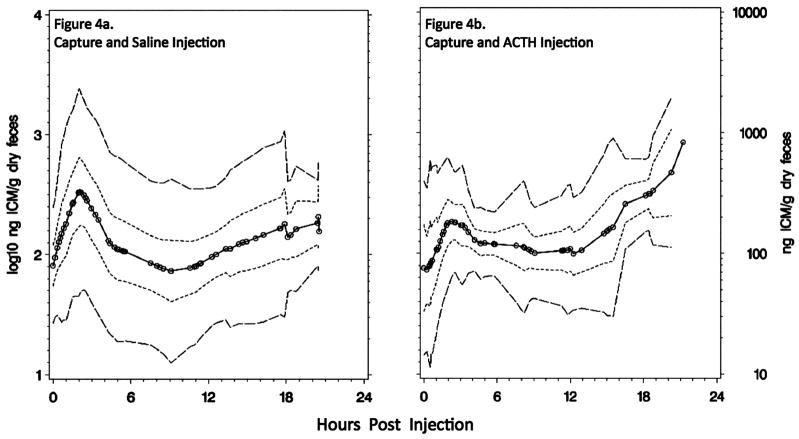
Figure 4.
Summary ICM responses to (a) capture, saline injection, and confinement (n = 8) or (b) capture, ACTH injection, and confinement (n = 7). Open circles indicate the time at which a single measurement was made. The innermost dotted line forms the mean ICM response curve for the group; the short dashed lines form 95% confidence intervals calculated with interpolated data; the outermost long dashed lines show prediction intervals calculated with interpolated data.

