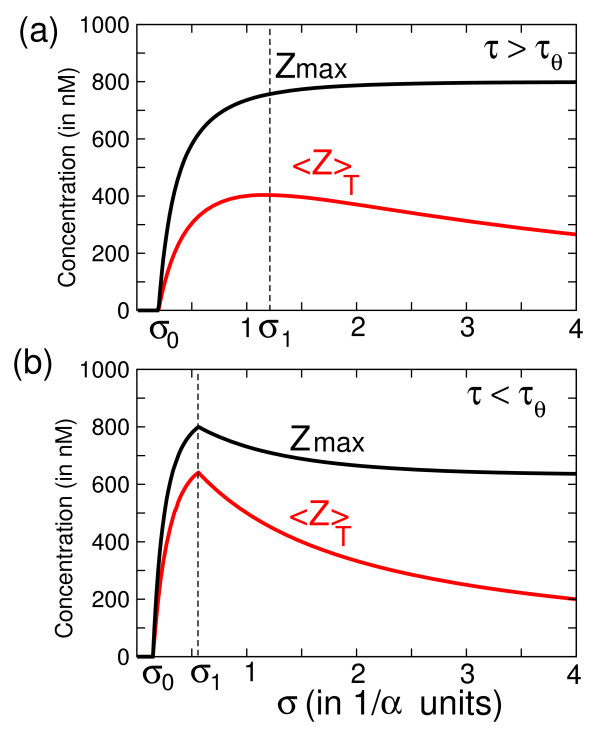
Figure 5.
Response of the IFFL to periodic stimulation in function of σ. The average response <Z >T and the maximum of response Zmax are represented in function of the inter-pulse interval σ with a fixed τ for an IFFL motif (Fig 1.(c)) stimulated by a pulsatile signal. σ is in 1/α units, the concentration is in nM. σ0 is the minimal inter-pulse interval for the system to respond. The inter-pulse interval σ1 gives the optimum average response for the system. The numerical simulation was done with the equations (4–5) of the main text and with the following parameters: (a) for the case τ > τθ, τ = 2 1/α unit. For example, the parameters: α = 0.01 min-1, β = 10 nM.min-1, θ = 800 nM and τ = 200 min give σ0 ~20 min and σ1 ~2 hours. (b) for the case τ <τθ, τ = 1 1/α unit. For example, the parameters: α = 0.01 min-1, β = 10 nM.min-1, θ = 800 nM and τ = 100 min give σ0 ~15 min and σ1 ~1 hour.

