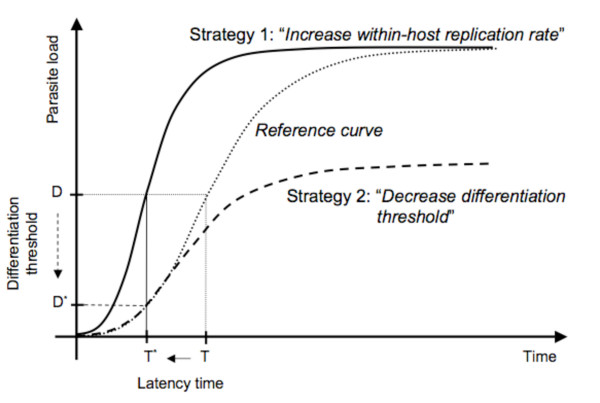
Figure 1.
Graphical representation of a simple theoretical model illustrating two different possibilities to evolve shorter latency. Latency denotes the time until the onset of conversion of reproductive forms into transmission stages (infectious forms). Suppose a hypothetical ancestral parasite with latency time T (dotted line). Reproductive forms make 1 division per unit time. At a density-dependent differentiation threshold (D = 100 reproductive forms), 60% of the reproductive forms are converted into infectious forms at each bacterial generation (infectious forms do not multiply). Shorter latency time (T*) can evolve in two ways. Strategy 1: Faster replication of reproductive forms (solid line) reduces the time to the differentiation threshold D, thereby reducing latency time (T*). Consequently, maximum parasite load is also reached earlier. Strategy 2: Replication rate of reproductive forms remains unchanged (dashed line), but the differentiation threshold is reduced (D*). This shortens latency time (T*), but also reduces parasite load. If parasite load correlates with consumption of host resources and thus virulence (graphically, the area under the curve), strategy 1 is associated with higher virulence, whereas strategy 2 is associated with lower virulence. NB: Hosts do not divide in this model; host mortality is nil.

