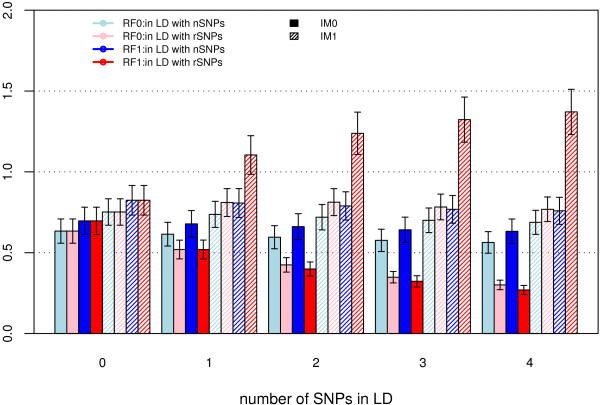
Figure 1.
Mean IM of rSNP when there are SNPs in LD with rSNPs. The data were simulated using model H4M4 with K4S4 analysis design. Four importance measures are illustrated in the figure using original random forest (RF0) and revised random forest (RF1) respectively. Solid color stands for original importance measure (IM0), i.e. the importance measures were averaged over all trees in a Forest. Shaded color stands for the revised importance measure (IM1), i.e. the importance measures were averaged over trees containing the variable.

