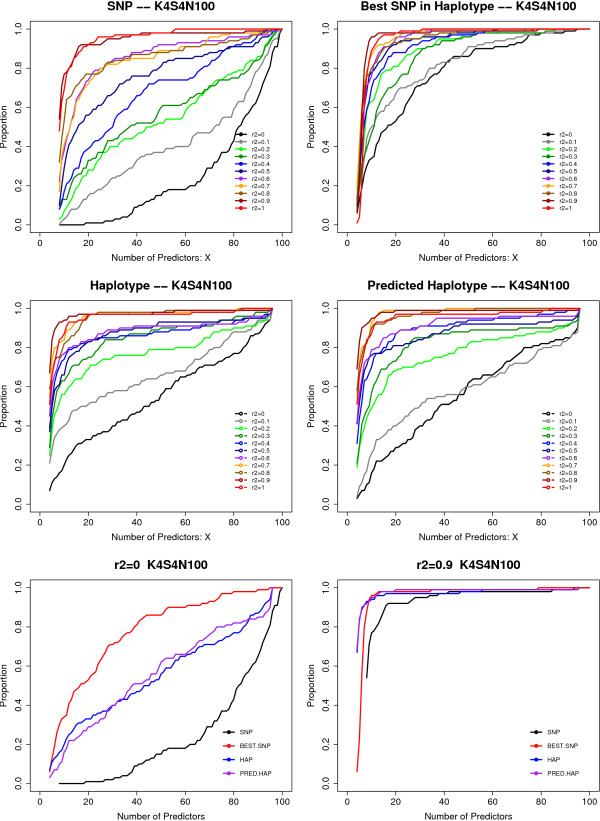
Figure 6.
Proportion of replicates for which all rSNPs or best rSNP in haplotype, and HAPs are among the top-ranking X SNP/HAPs. (A) Top panels. Individual SNPs are used in the RF as the predictors. Left: The proportion of replicates for which both SNPs making up the haplotype are among the top X predictors. Right: The proportion of replicates where at least one of the two SNPs in the risk haplotype are among the top X predictors. (B) Middle panels: Left: true haplotypes are used in the RF as the predictors. The proportion of replicates where the true haplotype is among the top X predictors. Right: the haplotype phases are not known, and are resolved statistically. The predicted haplotypes are used in the RF as the predictors. (C) Bottom panels (left, right) show the four analyses for haplotypes consisting of two SNPs with r2 = 0 and r2 = 0.9.

