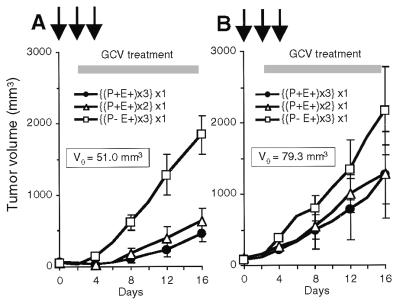
Figure 4.
Difference of effect of EGT by using the HS-tk-GCV approach caused by initial tumor volumes. Tumors with initial volumes at day 0 (V0) of 51.0 mm3 (A) and 79.3 mm3 (B) were treated by EGT with the HS-tk-GCV approach. Both groups of EGT with pCEP4/TK received twice (days 0 and 2) [▵, {(P+E+) × 2} × 1] or three times (days 0, 2, and 4) [●, {(P+E+) × 3} × 1] electro-gene transfer. The control group received three times the amount of mock procedures (injection of 50 μl of K-PBS with in vivo EP) on days 0, 2, and 4 [□, {(P−E+) × 3} × 1]. All mice in these groups received i.p. injection of GCV (3 mg/100 g b.w. × 2/day) from day 2 for 2 weeks. The results represent means; error bars show ±SD. Arrows indicate electro-gene transfer or mock procedures.

