Figure 1.
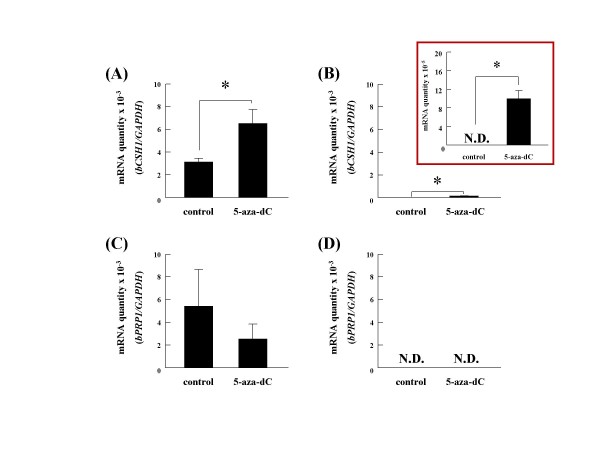
The effects of 5-aza-dC on BT-1 and endometrial fibroblast cells. The expression levels of bCSH1 (A, B) and bPRP1 (C, D) mRNA were determined by quantitative real-time RT-PCR. Ten μM of 5-aza-dC were added to both cell populations (A, C: BT-1; B, D: endometrial fibroblast cells). The expression levels were normalized to that of GAPDH mRNA. All results are displayed on a y-scale of 10-3, except for the insert in (B) where it is reduced to 10-5 to depict the low expression levels. Values are shown as the mean ± SEM, and values marked with an asterisk are significantly different (*P < 0.05).

