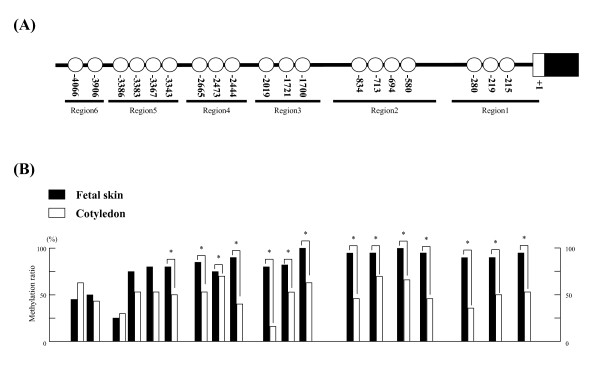
Figure 2.
The detection of CpG sites and the methylation status of bCSH1 in placentomes on day 150 of gestation. (A) The location of CpG sites in the bCSH1 5'-flanking region. (B) The DNA methylation ratio of Day 150 COT (n = 3, 10 clones for each sample) and Day 150 SKIN samples (n = 2, 15 clones for each sample). The black bars indicate SKIN and the white bars depict COT samples. Values show the percentage total from 30 clones, and values marked with an asterisk(s) are significantly different (*P < 0.05).

