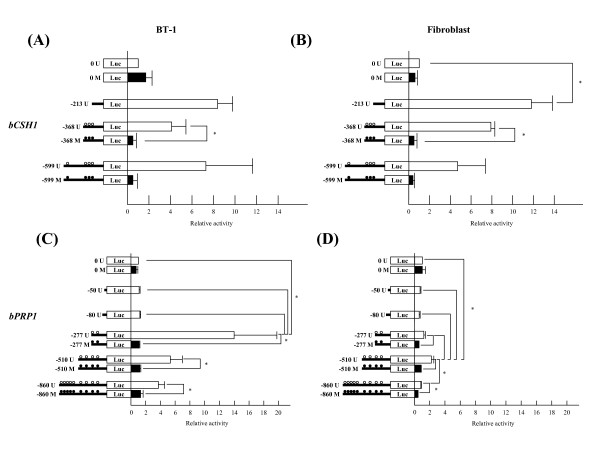
Figure 6.
The transcriptional activity of bCSH1 and bPRP1 constructs in BT-1 cells and fibroblasts. The transcriptional activity of BT-1 cells (A, C) and bovine fibroblast cells (B, D). (A) and (B) show that of bCSH1, while (C) and (D) show that of bPRP1. The left figures show constructs, the horizontal lines indicate the length of the constructs, and the circles indicate the CpG sites. "M" and the black circles indicate methylated constructs, and "U" and white circles indicate unmethylated constructs. The values are shown as the mean ± SEM (n = 3), and values marked with an asterisk(s) are significantly different (*P < 0.05).

