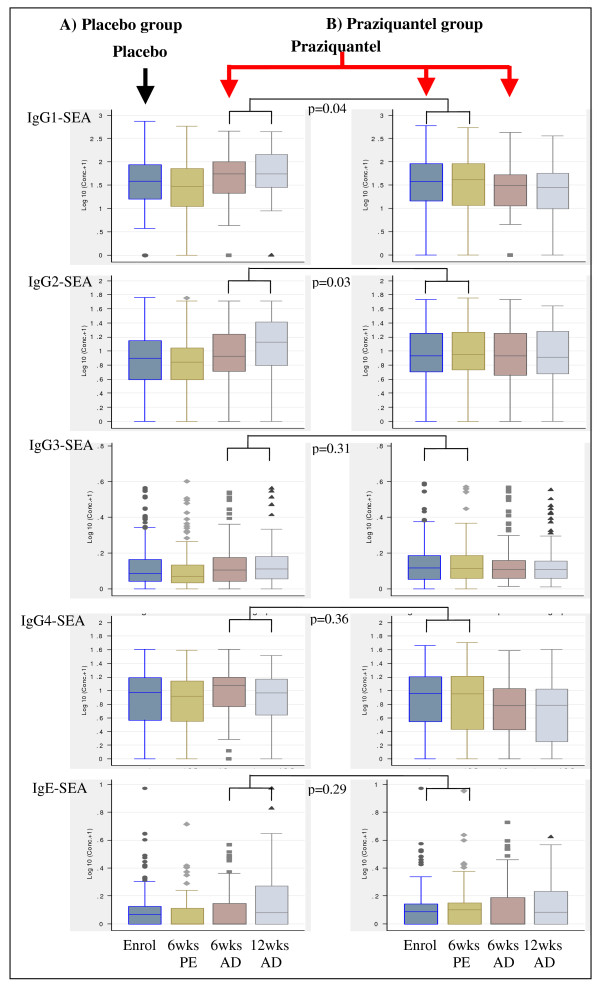
Figure 3.
Plasma levels of antibodies against S. mansoni egg antigen (SEA) and effect of praziquantel treatment during pregnancy or after delivery on the antibody levels. The y-axis shows log10 (antibody concentrations (pg/ml)+1). The x-axis shows time points: enrolment (Enrol), 6 weeks post-enrolment (6 wks PE), 6 weeks after delivery (6 wksAD) and 12 weeks after delivery (12 wks AD). The arrows indicate the intervention time points when the women were given either placebo (black) or praziquantel treatment (red). The box plots in column A are for participants who received placebo at enrolment during pregnancy and received praziquantel treatment for the first time six weeks after delivery. The box plots in column B are for participants who received praziquantel treatment during pregnancy. P values are given for the comparison in boost in antibody levels for praziquantel given for the first time during pregnancy vs after delivery, adjusted for pre-treatment antibody levels, S. mansoni infection intensity at enrolment and concurrent albendazole therapy. P values for other comparisons are given in the text.

