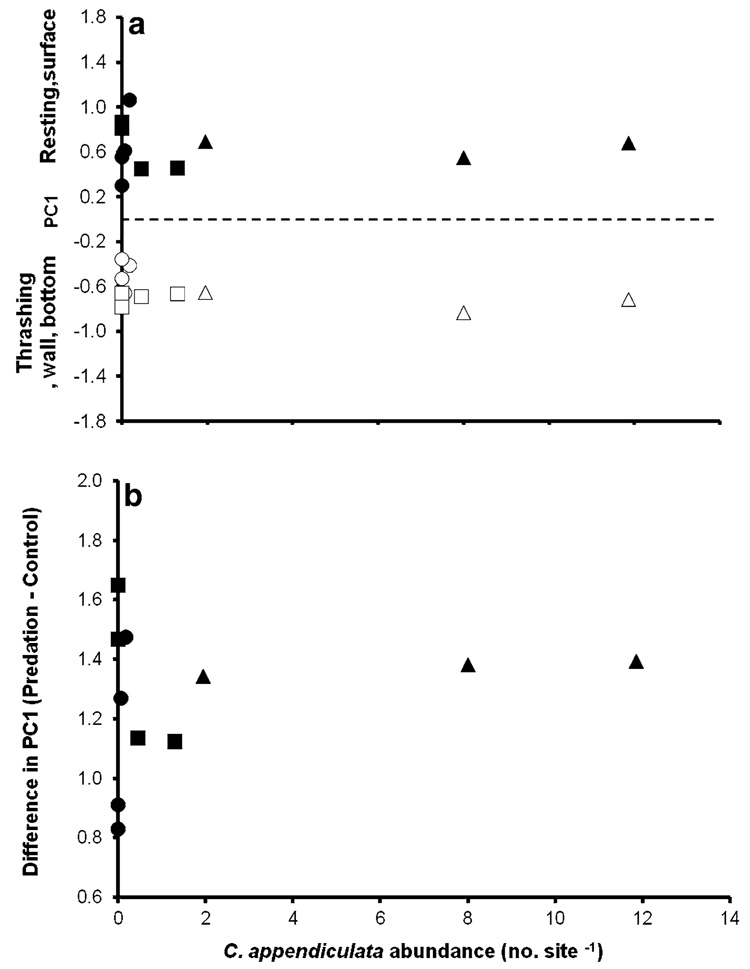
Fig. 4.
Correlation between C. appendiculata abundance (no. site−1) and a mean PC1 of control and predation treatments (control, CC = −0.446, P = 0.1483; predation, CC = −0.0487, P = 0.8870) and b difference in PC1 (i.e., change in behavior) for each site (CC = −0.229, P = 0.4960) with habitat types identified as cemeteries (circles), tires (squares) or tree holes (triangles). For abbreviations, see Fig. 2 and Fig. 3

