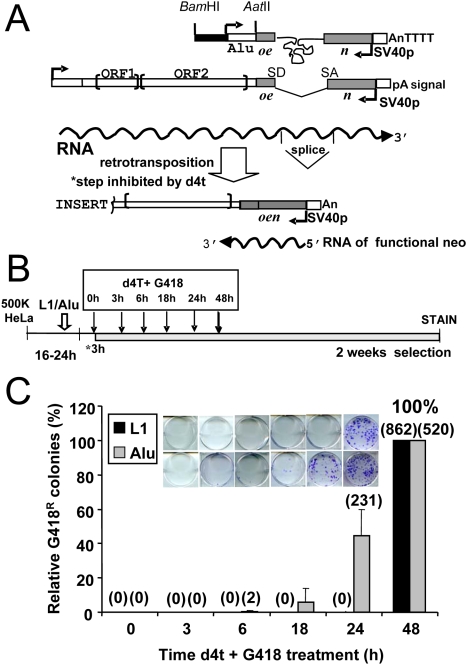
Figure 2. Alu and L1 Exhibit Different Retrotransposition Kinetics.
A. Assay design. A schematic of the constructs used for the L1 and Alu tissue culture assay are shown on the top. RNA transcription is driven by a CMV promoter for the L1 construct or the internal pol III Alu promoter. The restriction sites used in the construction of the other pol III driven vectors are shown. The L1 construct contains a full-length retrocompetent L1 element with its ORF1 and ORF2. The L1 vector is tagged with the mneoI indicator cassette containing an inverted neomycin resistance gene (neo, light gray box) disrupted by an intron [16]. The Alu vector contains a neo TET cassette with a tetrahymena self-splicing intron interrupting the neo gene [4]. In both constructs, the introns will only splice out from a transcript generated by the L1 or Alu promoter. The spliced RNA is reverse transcribed, followed by integration of the cDNA into the genome. The new insert contains a functional neomycin gene. G418 resistance will be obtained only if retrotransposition occurs. B. Schematic of treatment timeline. HeLa cells were seeded and transfected the next day with the appropriate constructs. After the three hour incubation with the transfection cocktail (3h*) the first set of cells was treated with d4t and G418 containing media (0 h). Note that at this time point the plasmid DNA has already been in contact with the cells for 3 h. The second set of cells was treated after 3 hours (3 h), and so forth until completing all the time points (shown as arrows above). Cells were stained after 2 weeks of growth under selection. C. Alu inserts are detected at 24 h, while L1 requires at least 48 hours to generate inserts. HeLa cells were transiently transfected with L1mneo (black bar) or AluYa5neo TET+ORF2p expression vector (gray bar) and d4t plus G418 treatment started 3, 6, 18, 24, and 48 h post-transfection (x axis). Inset shows representative G418R foci results of the retrotransposition assay. Bars represent the relative % mean G418R colonies±standard deviation shown as error bars for each construct. The 48 h data were used to define 100%. The mean of the observed G418 resistant colonies is shown in parentheses above each column.

