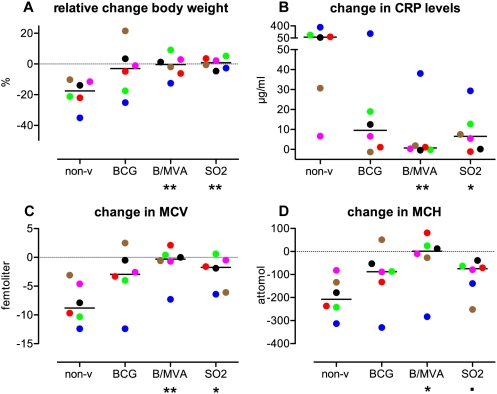
Figure 5. Evaluation of clinical measures along the infection phase.
The BCG/MVA.85A regime and SO2 vaccination in comparison to non-vaccinated controls show significant protection from TB-associated wasting disease and systemic inflammation. Individual scores and group medians are plotted for relative change in body weight from start to end of the infection phase (A), change in C-reactive protein (CRP) levels (B), in mean corpuscular volume (MCV) (C), and in mean corpuscular hemoglobin (MCH) (D). For legends of colouring and symbols see legend to Figure 2.

