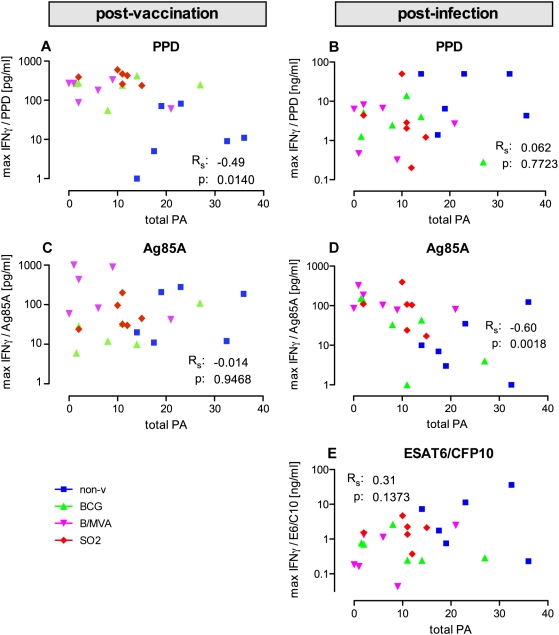
Figure 7. Immune correlations of disease.
Maximal PPD-specific IFNγ levels post-vaccination and maximal Ag85A-specific IFNγ post-infection show significant inverse correlations with TB disease by total gross lesion PA scores. Maximal antigen-specific IFNγ response levels are plotted per individual against total pathology scores (with colouring as indicated in the legend to figure 2 on group colouring) and post-vaccination and post-infection for PPD (A and B, respectively) and Ag85A (C and D, respectively), and for ESAT6-CFP10 fusion protein post-infection only (E).

