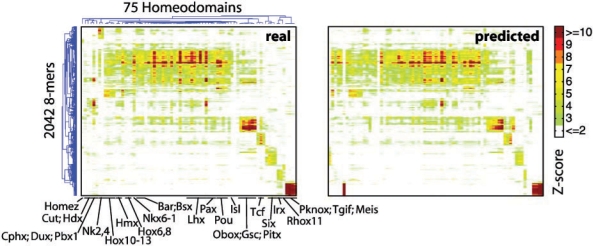
Fig. 1.
2D clustergram of Z-scores for 2042 8mers and 75 mouse homeodomains, as observed in either real PBM data (left) or NN predictions (right), with some of the established classes of homeodomains labelled. NN predictions were made using 6AA positions and leave-one-out cross-validation. The 2042 8mers were selected because they comprise the top 100 8mers by Z-score over the DBDs shown.

