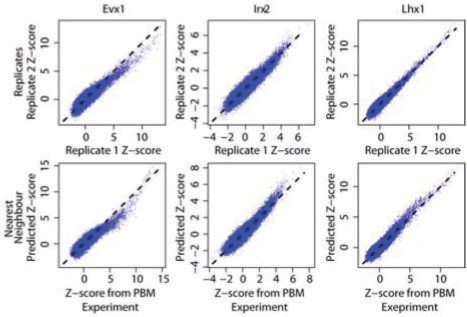
Fig. 2.
Comparison of the accuracy of NN predictions versus experimental replicates. Scatterplots show the measured Z-scores for all 32 896 non-redundant eight-base DNA sequences from one PBM versus a second PBM for the same DBD (top) or versus the Z-score predicted using NN (6AA variant; bottom). Median performance metrics are given. Evx1 has a single NN (Hoxa2); Irx2 has a single NN (Irx3); Lhx1 has two NN (Alx3 and Lhx3).

