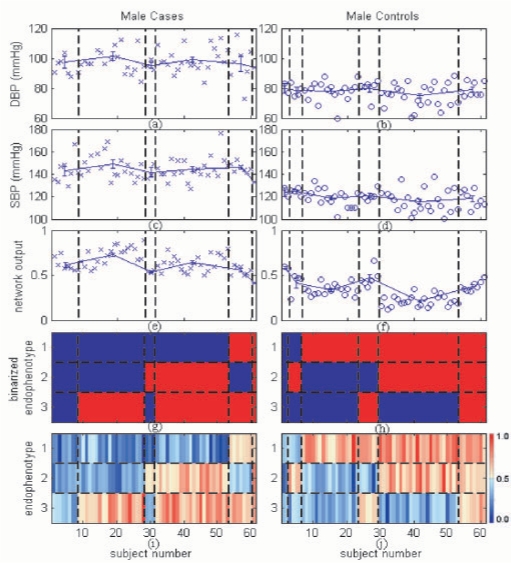
Fig. 2.
Average blood pressure values [diastolic blood pressure (DBP), systolic blood pressure (SBP)] and average network outputs across various endophenotypic patterns using training data: a blue circle or cross indicates a data point for an individual; error bars indicate the means and standard errors (SEs) of subject subgroups. (a and b) Individual DBP, their mean values and SEs. (c and d) Individual SBP, their mean values and SEs. (e and f) The network outputs, their mean values and SEs. (g and h) Binarized endophenotype values (using a threshold of 0.5) showing endophenotypic patterns. (i and j) Original endophenotype values represented in a gradation of red and blue colors (refer to the color bar at the right-hand side for actual magnitude); the vertical blocks between the black dashed lines denote subject subgroups defined by different endophenotype patterns (refer to g and h); horizontal blocks denote endophenotypes.

