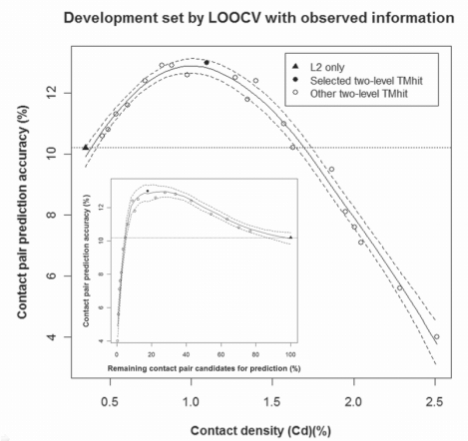
Fig. 2.
Comparison of contact pair prediction accuracy as a function of Cd by direct and two-level models on the development set using observed information (topology and RSA). Direct prediction (L2 only) is shown in filled triangle and its accuracy is shown in a dotted horizontal line. Two-level models are shown in filled (selected) or empty circles (others). The regression curve was estimated from all models (smoothing parameter α = 0.8) using the LOCFIT package (Loader, 2004) and the dashed line indicates the confidence band at 95% confidence limits. Inset: comparison of prediction accuracy as a function of percent remaining contact pair candidates for prediction by Level 2.

