
Fig. 3.
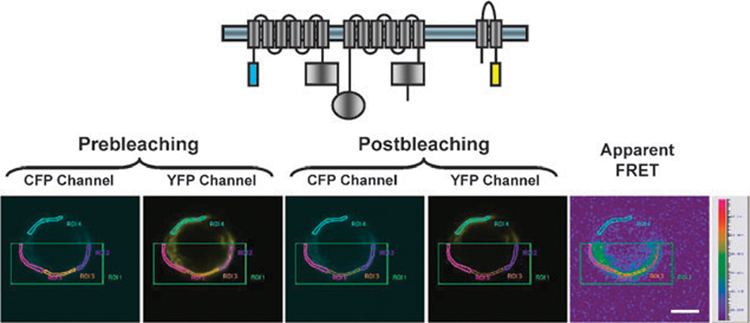
FRET acceptor photobleaching of cells transfected with ECFP–CFTR and α-EYFP–ENaC. The area of photobleaching is highlighted by green boxes. ECFP and EYFP images were taken both before and after acceptor photobleaching. Apparent FRET efficiency is displayed as a pseudocolor representation. Scale, 5 µm. Reproduced with permission from Berdiev et al., 2007, The American Society for Biochemistry and Molecular Biology.74