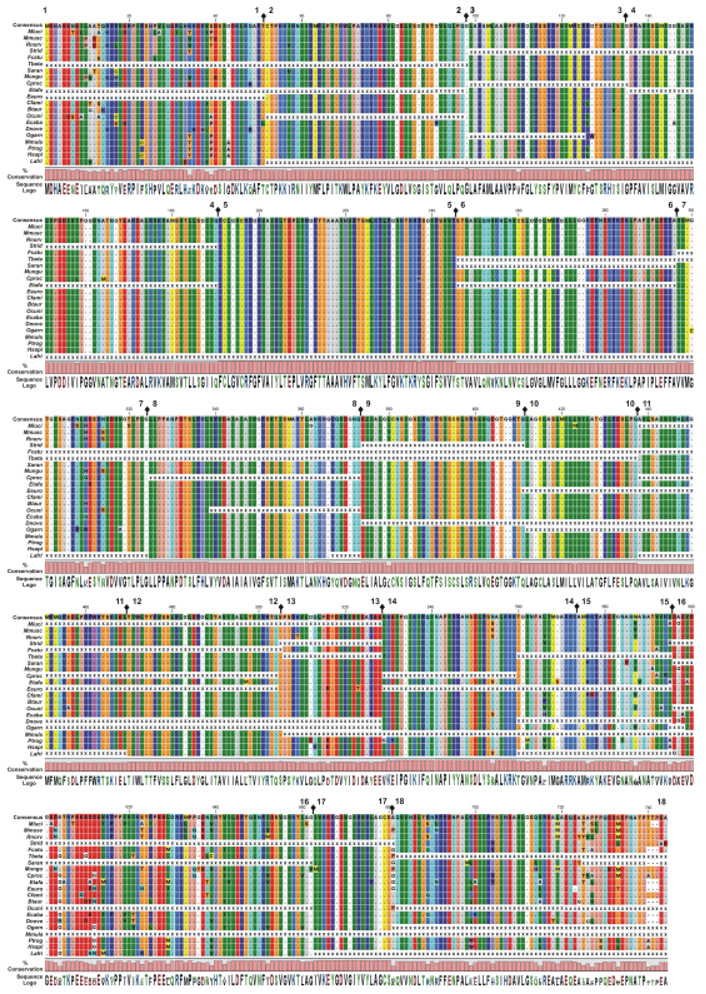
Fig. 4.
Alignment of the eutherian SLC26A5 proteins. The deduced polypeptide sequences from eutherian species compared with a SLC26A5 eutherian consensus sequence. The eutherian species are arranged from high- to low-frequency specialists. The amino acid alignments are presented with identical residues represented as dots. Background color of each residue is presented using RasMOL colors designations (Sayle and Milner-White, 1995). Gaps in the aligned sequences are indicated by the dashed line. The residue conservation and utilization (Sequence logo) are provided and absence of sequence data is indicated by X. Residue number and the location of each coding exon (➋) are provided at the top of each row of sequence.

