Fig. 6.
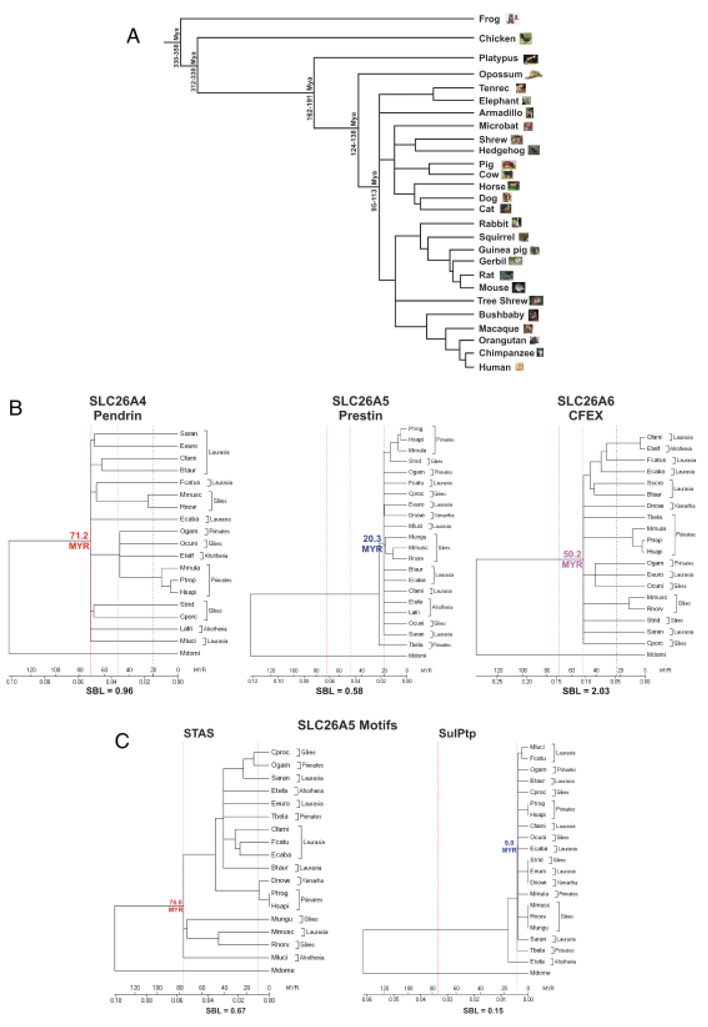
Cladograms of the evolution of the SLC26A4, 5, and 6 proteins and the corresponding SulPtp and STAS motifs of the consensus eutherian SLC26A5 polypeptide. (A) The tree of evolutionary relationships of mammalian species used in this analysis with the frog and chicken serving as the outgroups as modified from (Benton and Donoghue, 2007). The branch lengths are proportional to the length in million of years (Myr) at the time of divergence of the taxa. The minimum age constraints are based on the oldest fossil evidence and maximum ages are based on bracketing the ages of sister groups in the fossiliferous formation. (B) Phylogenetic analysis of the SLC26A4 (pendrin), SLC26A5 (prestin), and SLC26A6 (CFEX) are shown using the opossum (Mdome) as the outgroup. Trees were established using MEGA4 program (Tamura et al. 2007) with the following parameters: neighbor-joining, pairwise deletion, constant substitution rate, and the amino acid JTT matrix. The sums of the branch lengths (SBL) are given. The time scale (Myr) is based on the divergence of the marsupials from the eutherian lineage and are represented by red line (71.2 Myr—SLC26A4), a dashed blue line (20.3 Myr—SLC26A5), and a dotted purple line (50.2 Myr—SLC26A6). (C) Phyogenetic trees are shown for the SLC26A5 protein motifs, STAS (red line—76.6 Myr) and SulPtp (blue dotted line—9.0 Myr). Opossum was used as the outgroup and a time scale (Myr) and SBL are indicated.

