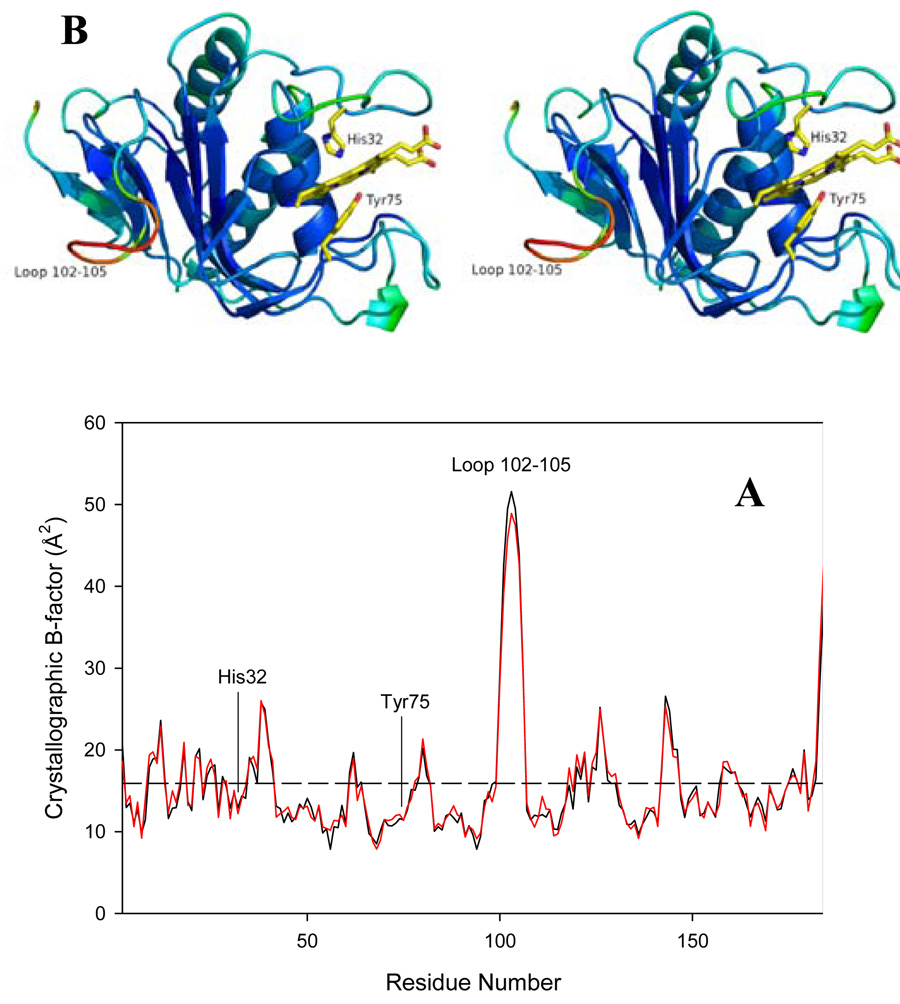
Figure 4.
(A) Per residue plot of B-factors of the Cα atoms in monomer A (black line) and monomer B (red line). The average B-factor of all main chain atoms is 15.9 Å2 for both monomers (dashed horizontal line). (B) Stereo representation of molecule A of the HasAp crystal structure color coded according to thermal factors, with blue representing 8 Å2 and red 51 Å2. The heme and its axial ligands His32 and Tyr75 are shown in yellow.

