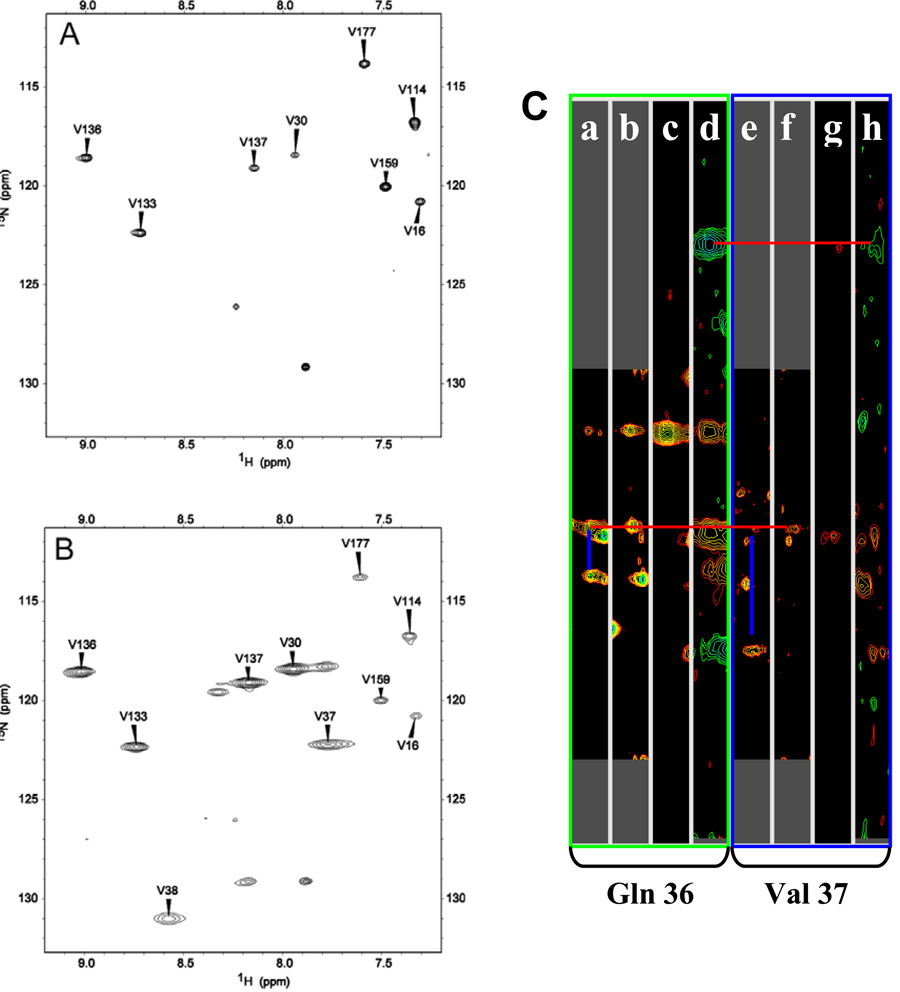
Figure 6.
1H-15N HSQC spectra of [15N-Val]-truncated-HasAp acquired with standard conditions (A) 128 (t1)×1632 (t2) complex points; spectral width, 2.4 kHz (t1)×9.60 kHz (t2); acquisition time, 85 ms; recycle delay, 1 s; 32 scans per increment. (B) fast recycling conditions; 128 (t1)×1050 (t2) complex points; spectral width, 3.6 kHz (t1)×15 kHz (t2); acquisition time, 35 ms; recycle delay, 50 ms; 256 scans per increment. (C) Strip plots showing heteronuclear correlations of residues Gln36 and Val37 in: HNCA, a) and e); HN(CO)CA, b) and f); CBCA(CO)NH, c) and g); and HNCACB, d) and h) spectra obtained with [U-13C, U-15N]-truncated-HasAp. Blue lines are used to highlight HN to Ciα and Cα i-1 correlations in HNCA strips, whereas red lines illustrate correlations between HN of both Gln 36 and Val 37 to the Cα and Cβ cross-peaks of Gln 36.

