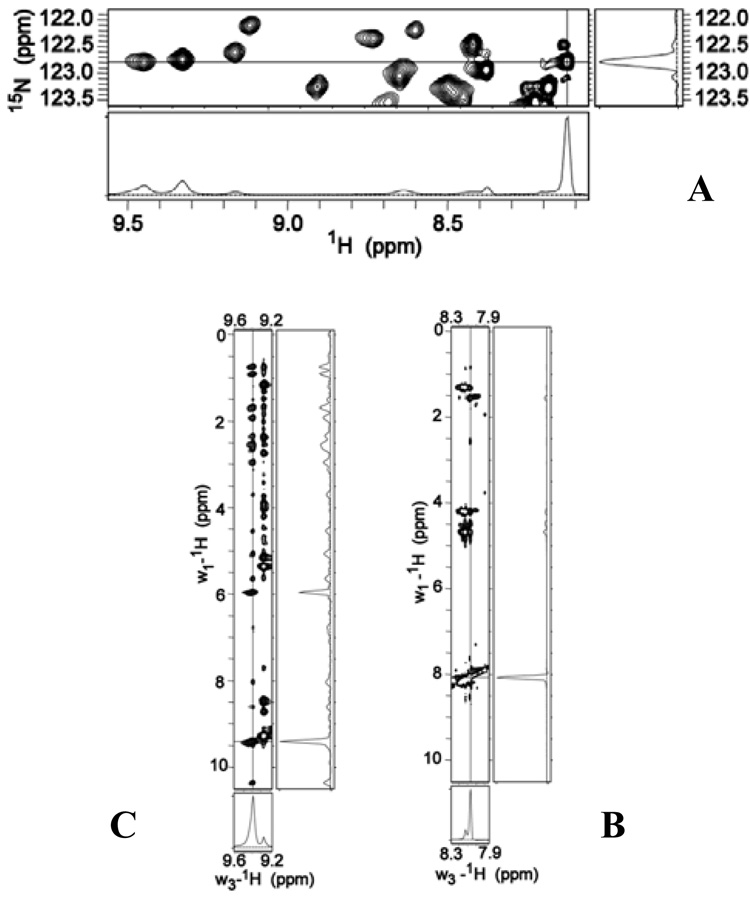
Figure 8.
(A) A portion of the 1H-15N HSQC spectrum obtained from [U-15N]-full-length HasAp. The slices were obtained at the cross-peak corresponding to Leu201 (δ(1H) = 8.13 ppm and δ(15N) = 122.8 ppm). The intensity of this N-H hydrogen cross-peak is significantly larger than the intensity of two other N-H hydrogens attached to nitrogens resonating at the same 15N frequency. These are the protons at 9.34 and 9.46 ppm. (B) A 1H-1H 2D slice obtained from a 3D NOESY HSQC (tmix = 110 ms) spectrum of full-length HasAp. The slice was obtained at the 15N frequency of Leu201 and shows the few NOEs detected for the corresponding cross-peak at δ(1H) = 8.13 ppm. (C) Same as B, except that the cross-peak corresponding to Tyr56 at δ(1H) = 9.34 ppm shows several NOEs, as is typical of cross-peaks in structured proteins.

