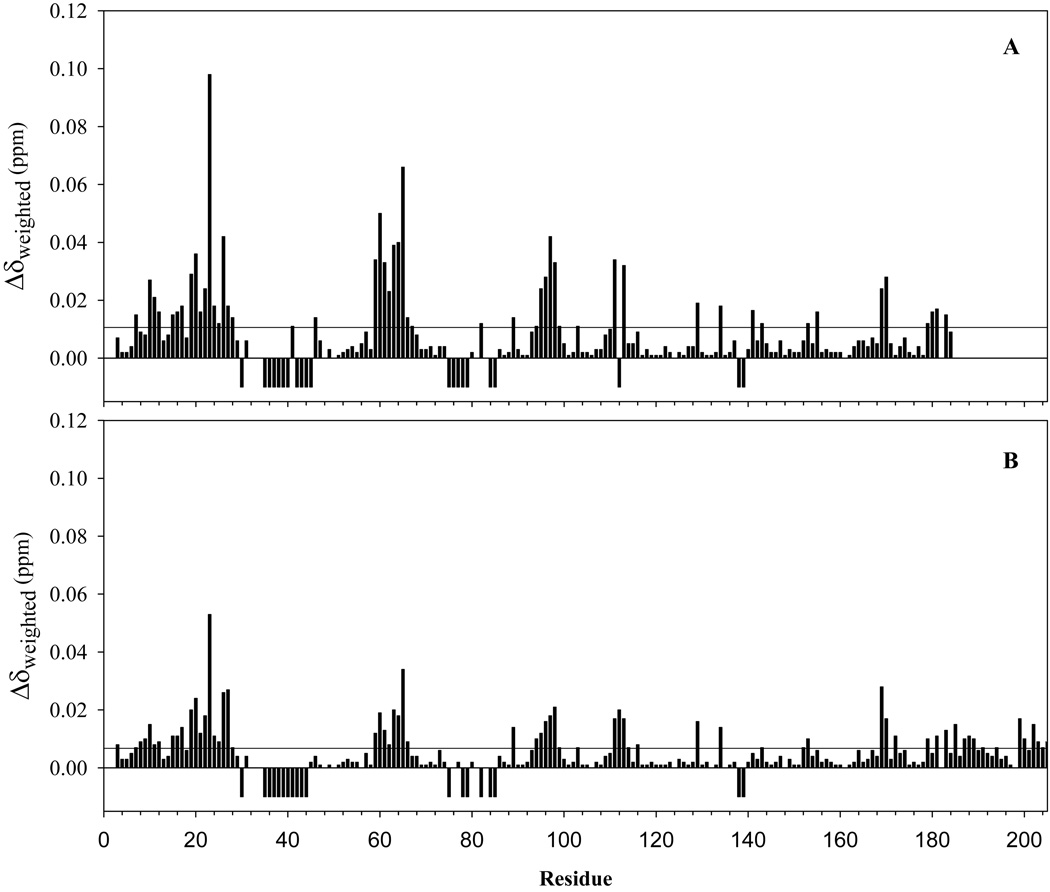
Figure 9.
Per residue plot of cross-peak perturbations associated with the titration of (A) truncated- [U-15N]-HasAp and (B) full-length-[U-15N]-HasAp with met-Hb. The weighted values of chemical shift perturbations were obtained from . The average of all chemical shift perturbations is 0.011 in (A) and 0.0067 in (B) The two plots are presented with the same vertical scale two illustrate that the chemical shift perturbations are larger in the case of truncated HasAP. The negative peaks correspond to residues whose resonances disappear in the course of the titration.

