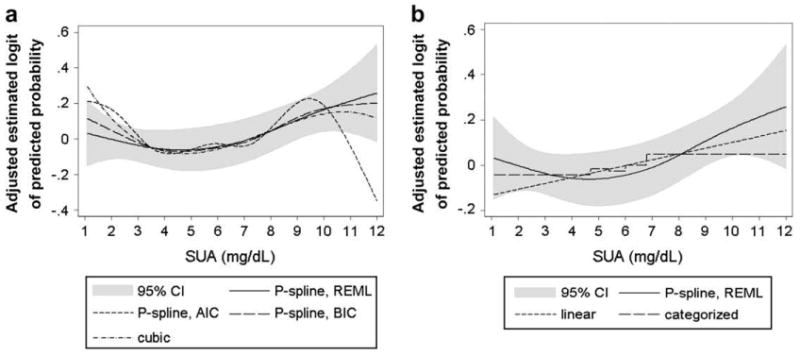
FIGURE 3.

Comparison of estimated adjusted logits of the predicted probability of cancer incidence according to SUA concentrations (in mg/dL) in 78,850 male VHM&PP participants from different extended Cox-type additive hazard regression models. (a) REML-optimal, AIC-optimal, and BIC-optimal model with time-varying SUA modeled as penalized spline and time-varying SUA modelled as cubic polynomial. (b) Time-varying SUA modeled as linear function and categorized variable (using quintiles) in comparison with the REML-optimal P-spline model. 95% CIs are shown for the REML-optimal P-spline model. All models are adjusted for age, BMI, smoking status, occupational status, and year of entry into the cohort. For abbreviations, see legend to Figure 1.
