
FIG 4.
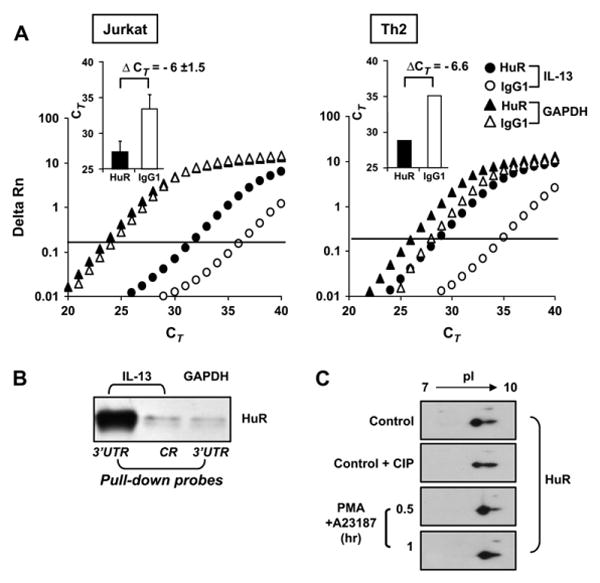
Association of HuR with IL-13 mRNA and posttranslational changes of HuR. A, Representative real-time PCR amplification plot of fluorescence intensity over background (Delta Rn) against PCR cycle (CT) of IL-13 and GAPDH mRNA in stimulated Jurkat (n = 3) and TH2-skewed cells (n = 2) subjected to IP with the anti-HuR antibody (solid symbols) or with control antibody (open symbols). In the bar graph inserts the IL-13 datasets are expressed as the means ± SEMs CT of the IP with anti-HuR (black bars) or the control antibody (white bars). B, Western blot of HuR after biotin pull-down assay (representative of n = 3). C, Detection of HuR by means of 2-dimensional Western blot analysis (representative of n = 4) in Jurkat cells unstimulated (Ctrl) or treated for the indicated times. Lysates from unstimulated cells were run in the absence or presence of treatment with calf intestinal phosphatase (CIP) before separation in the first dimension.