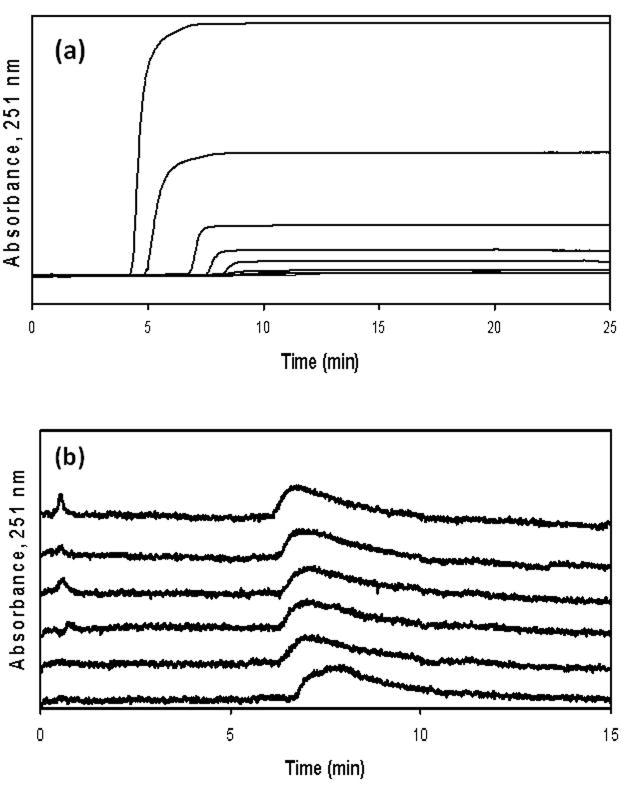
Figure 2.
(a) Frontal analysis curves obtained for imipramine on an HSA column and (b) competition studies on an HSA column in which imipramine is the injected analyte and L-tryptophan is used as a mobile phase additive. The concentrations of applied imipramine in (a) (from top-to-bottom) were 100, 50, 20, 10, 5, 2, 1.5, 1, and 0.75 μM, respectively. In (b) the injected sample contained 20 μM imipramine and the concentrations of L-tryptophan in the mobile phase (from top-to-bottom) were 300, 150, 100, 50, 20, and 5 μM, respectively. The dashed line in (b) is included as a reference point and shows the mean position of the peak for imipramine in the presence of 0 μM L-tryptophan. All of these experiments were conducted at pH 7.4 and 37°C. Other experimental conditions are given in the text.

