
Figure 4.
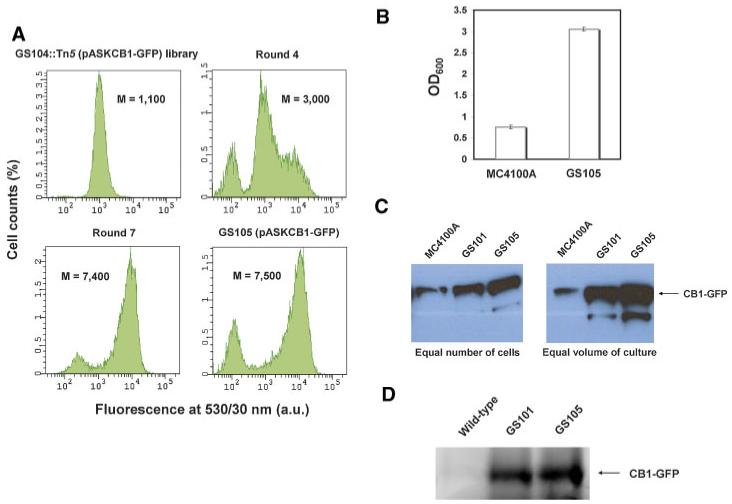
Transposon mutagenesis and FACS screening on the GS104 (MC4100A ΔdinG) strain background. A: Enrichment of the MC4100A ΔdinG::Tn5 (pASKCB1-GFP) library with higher-fluorescence clones after repeated rounds of FACS sorting and the identification of the strain GS105 (MC4100A ΔdinG dnaJ::Tn5) exhibiting markedly higher CB1-GFP fluorescence. Fluorescence histograms correspond to a total population of 10,000 cells. M: arithmetic mean; a.u: arbitrary units. B: Comparison of the cell density at saturation of parental MC4100A and GS105 cells expressing CB1-GFP. The reported data correspond to the average of four replica experiments and the error bars represent one standard deviation from the mean value. OD600: optical density at 600 nm. C: Comparison of the production of membrane-integrated CB1-GFP fusion in parental MC4100A, GS101, and GS105 cells normalized by number of cells (left) and by unit volume of bacterial culture (right) with Western blotting. D: Comparison of the in-gel fluorescence of membrane-integrated CB1-GFP fusion in parental MC4100A, GS101, and GS105 cells normalized by unit volume of bacterial culture. In all panels shown above, CB1-GFP was expressed at 12°C for approximately 30 h. [Color figure can be seen in the online version of this article, available at www.interscience.wiley.com.]