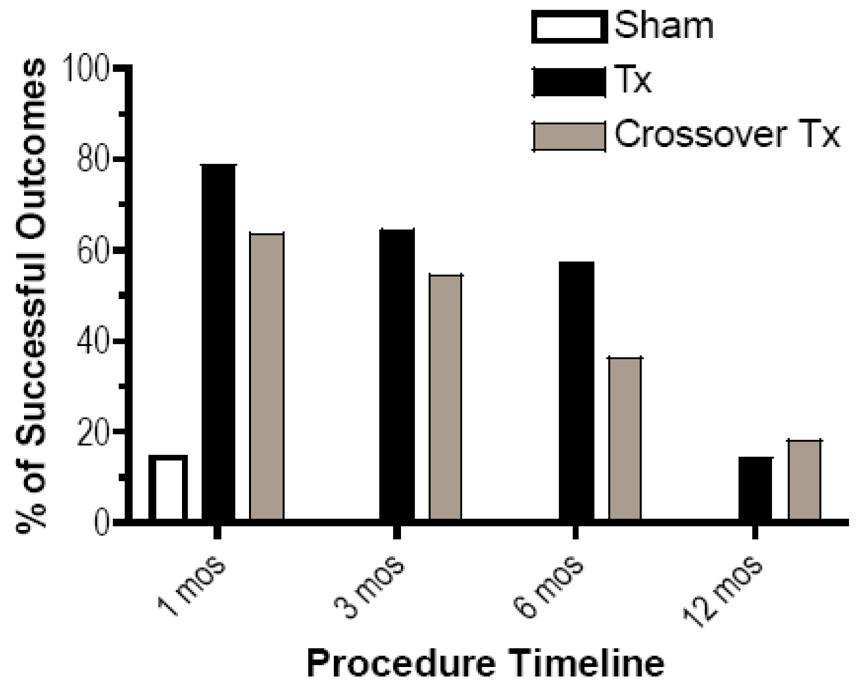
Figure 4.
Bar graph demonstrating the percentage of patients with a successful treatment outcome at various time points. A positive outcome is defined as a ≥ 50% reduction in numerical pain score, a positive global perceived effect, and either a 10-point decrease in Oswestry disability index score or a 4-point decrease coupled with a reduction in medication usage.
Footnote: TX- treatment

