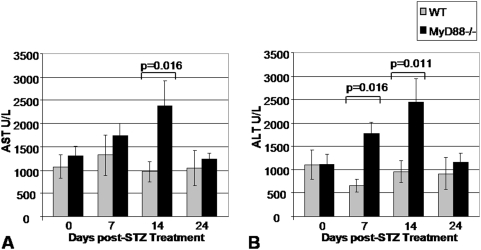
Figure 5. Transaminase Levels Following STZ Treatment.
Data shown are for A. AST and B. ALT for 8 WT mice and 8 Myd88−/− mice who received low-dose STZ treatment for 4 days. The animals in this experiment were the same set of mice described in Figure 4 and data for the same time points 7, 14, and 24 days post completion of the low-dose STZ treatment course are shown.

