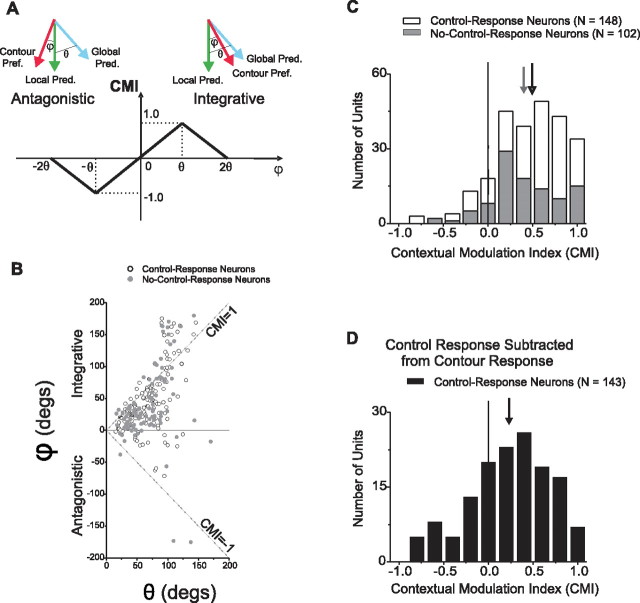
Figure 5.
A, CMI definition. The CMI is based on the ratio of ϕ and θ. ϕ is the angular difference between the directional preference for a particular stimulus (e.g., the contour preferred direction) and the local prediction. θ is the angular difference between the global and local predictions. The CMI varies from −1 to 1 as ϕ varies from −θ to θ and its magnitude falls off linearly as the absolute value of ϕ deviates from θ. B, Scatter plot of ϕ versus θ. In this illustration, θ is defined to be positive (i.e., the absolute value of the difference between the global and local predictions). Positive and negative ϕs indicate integrative and antagonistic modulation. The top and bottom diagonal lines indicate CMIs of 1 and −1, respectively. As indicated in Figure 5A, the magnitude of the CMI falls off as the distance from these two diagonals increases so that, for example, points above the top diagonal have CMIs <1. C, CMI frequency distribution. The CMIs for the two example neurons shown in Figures 3 and 4 are 0.80 and 0.63, respectively: both neurons exhibited motion integration. Of the 279 neurons in our sample, the observed surround modulation of 250 was readily interpretable as either integrative or antagonistic. The mean CMI value of these neurons with interpretable modulation (see Materials and Methods) is 0.46, which is significantly greater than zero (Student's t test, p = 2.5 × 10−49), indicating integrative modulation. The gray histogram shows the CMI distribution for 102 no-control-response neurons. The mean CMI for these neurons is 0.40, which is significantly greater than zero (Student's t test, p = 2.8 × 10⁻¹⁹). The mean CMI of the remaining 148 control-response neurons is 0.49, which is also significantly greater than zero (Student's t test, p = 4.4 × 10⁻³²). D, For control-response neurons, we subtracted the control responses from the corresponding contour responses and recomputed the CMIs again. The distribution of CMIs had a mean that was significantly positive (mean = 0.23, Student's t test, p = 6.4 × 10⁻⁷). Hence, the directional selectivity seen in the contour responses is greater, at the population level, than that predicted by control stimulus responses.

