
Figure 9.
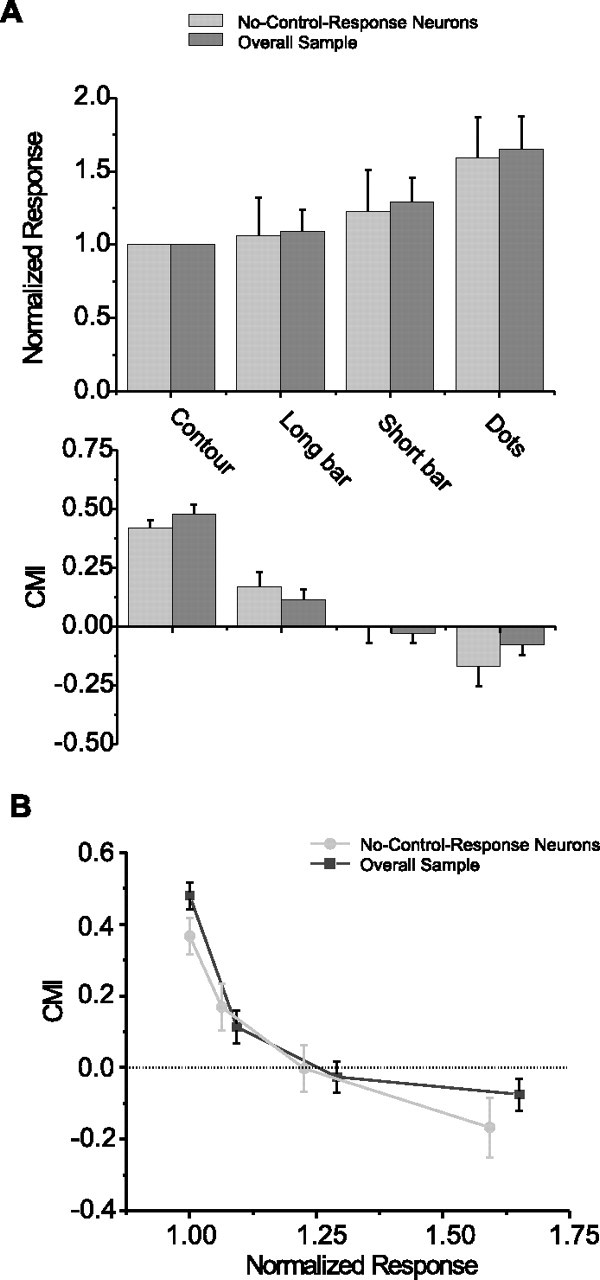
Relationship between firing rate and surround modulation. A, Top panel shows the averaged response to the P and the PP directions across neurons in the contour, long-bar, short-bar, and dot conditions. Response magnitude was normalized to maximum response to contour stimuli. Bottom panel shows averaged CMIs in these stimulus conditions. Dark gray bars depict results from the overall sample (N = 208 for contour stimuli; N = 57 for long-bar and short-bar stimuli; N = 86 for dot stimuli), and light gray bars depict results from no-control response neurons (N = 97 for contour stimuli; N = 28 for long-bar and short-bar stimuli; N = 42 for dot stimuli). Error bars indicate SE. B, Cross-plot of CMI as a function of normalized response magnitude. As the response magnitude increases (across stimulus conditions), the average CMI decreases and changes from integrative to antagonistic.