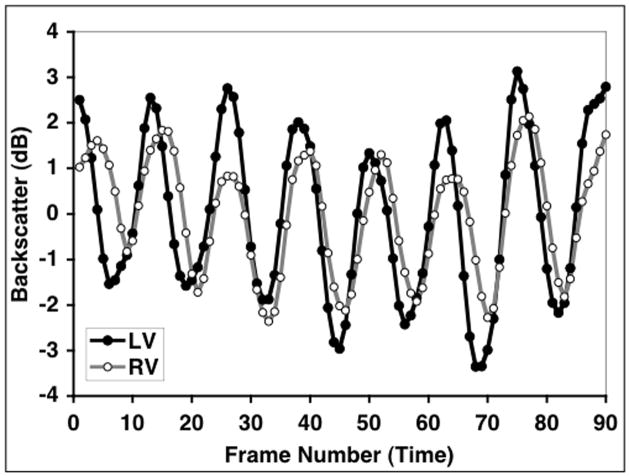
Figure 3.
Cyclic variation data from the left- and right-ventricular free walls acquired from one of the fetal subjects. These data have been low-pass (binomial) filtered and plotted as zero-mean curves in order to illustrate differences in the magnitudes of the cyclic variation from the two sides of the heart.

