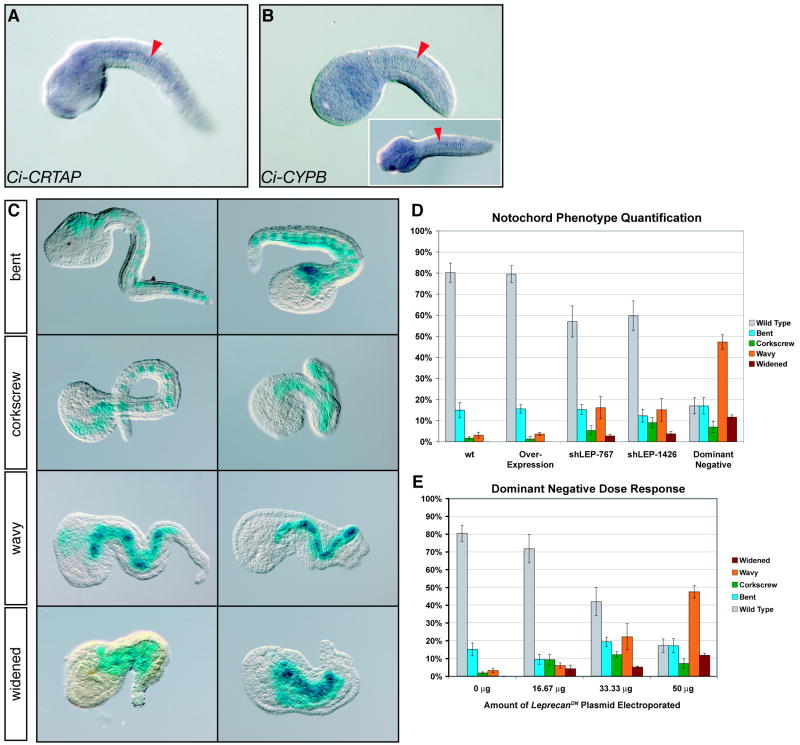
Figure 5. Effects of Ci-leprecan gain-of-function and loss-of-function on notochord development.
(A, B) Whole-mount in situ hybridizations performed on mid-tailbud embryos with antisense RNA probes specific for Ci-CRTAP (A) and Ci-CYPB (B). The notochord is indicated by red arrowheads. The inset in (B) shows a dorsal view. (C) Classification of the notochord phenotypes based on tail morphology. Different phenotypes are arranged in order of increasing severity from top to bottom. All panels show mid/late-tailbud embryos co-electroporated with the marker construct 434-bp Ci-Bra->LacZ and the Ci-Bra->Ci-leprecanDN∷RFP construct. (D) Quantification of the occurrence of notochord phenotypes in embryos electroporated with the 434-bp Ci-Bra->LacZ construct alone (wt) or in combination with Ci-Bra->Ci-leprecan (over-expression), shLEP-767 or shLEP-1426 (both shRNA), or Ci-Bra->Ci-leprecanDN∷RFP (dominant-negative). The different phenotypes are color-coded as shown by the key on the right side of each graph. (E) Graph plotting the variation in the relative fractions of the different phenotypes seen in response to increasing concentrations of the Ci-Bra->Ci-leprecanDN∷RFP transgene. For experimental consistency, the “0 μg” point represents embryos electroporated with 50 μg of the 434-bp Ci-Bra->LacZ construct.

