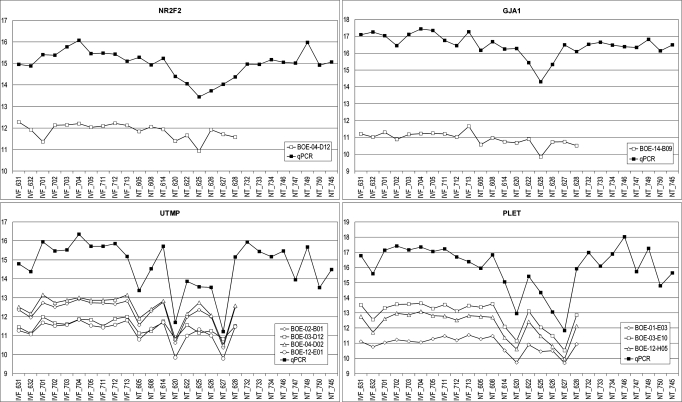
Fig. 3.
Comparison of expression profiles obtained by array analysis and qPCR. Microarray data are shown as normalized values (generalized logarithm). Data from the qPCR are shown as 35–CP for optimal visualization of array and qPCR data in the same diagram. The IDs of the BOE array cDNA clones are indicated.

