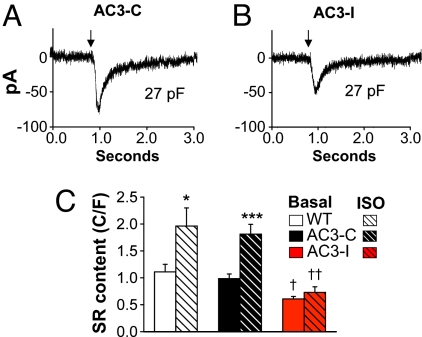
Fig. 6.
SR Ca2+ content is reduced in AC3-I SAN cells. (A and B) Representative INCX recordings from an AC3-C (A) and AC3-I (B) SAN cells in response to a caffeine spritz (at arrow). SR Ca2+ content is calculated from the integral of INCX (see Materials and Methods for details). (C) Summary data for SAN SR Ca2+ content at baseline and after 1 μM ISO (n = 6–9/group). †, P <0.05 and ††, P <0.01 compared with WT and AC3-C; *, P <0.05 and ***, P <0.001 compared with basal.

