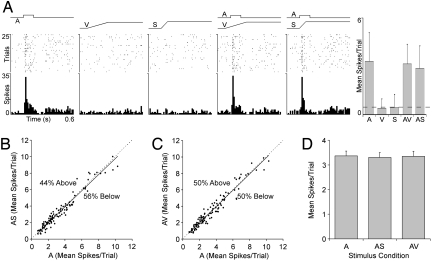
Fig. 3.
Responses of auditory neurons from hearing adult ferret to auditory, visual, somatosensory, and multi-sensory stimulation. (A) Responses of a typical neuron in A1 of a hearing adult to auditory (square-wave labeled A, contralateral white noise, 75 dB SPL, 100 ms), visual (ramp labeled V, light bar moved across the visual field), somatosensory (ramp labeled S, tactile probe indented skin on contralateral cheek), and combined stimulation (AV and AS) are shown in the rasters (1 dot represents 1 spike; each row represents 1 trial) and histograms (10-ms time bins). As summarized in the bar graph (mean spikes/trial ± SD; spontaneous activity indicated by dashed line), the neuron responded vigorously to the auditory stimulus, with no response to the visual or somatosensory stimulus. Because the response to the auditory stimulus alone was not statistically different from that of the combined stimuli conditions (AV or AS), this auditory neuron did not show subthreshold cross-modal effects. For the population of auditory neurons examined (n = 111), B and C plot the responses to the auditory stimulus alone (A; x axis) to those evoked by the combined stimuli (AS or AV; y axis). In both graphs, most responses fell on or near the line of unity (dashed), with similar numbers either slightly above or below. (D) Bar graph shows the population response average (mean spikes/trial ± SEM) to the auditory stimulus alone (A), auditory-somatosensory combined stimuli (AS), and auditory-visual combined stimuli (AV), which were not significantly different (P > 0.05).

